Introduction
During the fall 2025 semester, rather than doing an academic term, I did a co-op sequence as part of my co-op degree. The company I worked at was ComPeters, a SaaS company that provided software for utility companies to send work orders to contractors who demark utility lines.
My work
Due to some unforeseen circumstances, I was unable to work on the core code in production at ComPeters. However, alongside another co-op student, I was given a project to lead where we analyzed NFL game data to predict pre-kickoff win probabilities.
This was a very open-ended project: so long as we could convince stakeholders that our design decisions were logical, they would permit it. However, this would both be a blessing and a curse later down the line...
Chapter 1: The turtle and rabbit
We were told that our backend and data pipeline had to exist solely on AWS. I had prior experience working with infrastructure through locally hosting Kubernetes for a homelab, but not cloud. However, my project teammate did not. This presented a big problem I failed to catch on early: I went too fast.
During project planning, I skipped over planning the backend and data pipeline architecture, jumping directly to creating the prediction models for games whilst my teammate was confused and left behind. Fortunately, my boss did notice, and we resolved it by using tasks in the form of AGILE development strategies. Informally, we treated it more as a task-based list we just had to do, and did weekly stand-ups together to see where we were on progress. This allowed me to help him on certain problems he was struggling with such as IaC (Infrastructure as Code).
My job
After finally getting some basic team organization running, my project member and I decided that I would focus more on setting up the initial project through Pulumi to handle IaC and creating a basic PostgreSQL migration script, as well as handling the data pipeline + model building given I had taken some statistics courses. Meanwhile, he would handle creating the backend "interface" to create logging and insights into weekly predictions made by the model.
Chapter 2: Data analytics
This is where the project became fun. Sadly, I can only publish a small subset of the data analyzed due to employer restrictions. Originally, the idea was to use a regression and/or a genetic algorithm to initially develop the model to do predictions. However, upon analysis of EPA data using Pandas, we discovered our data set was highly collinear and scattered, making it difficult for regression models to work with. For example, injury data was sparse and unreliable, so we couldn't rely on it.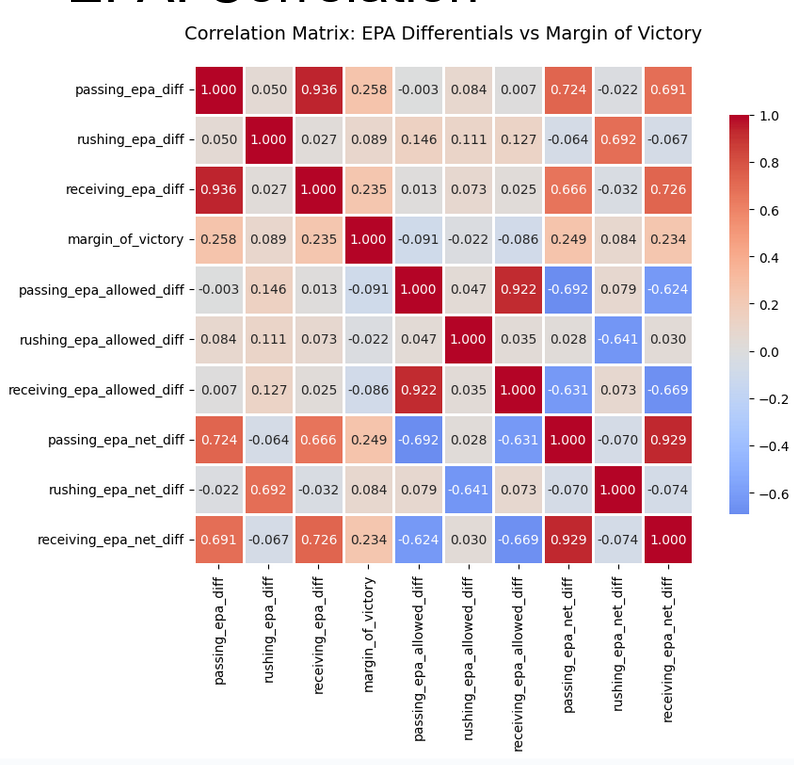
Why not genetic algorithms?
They can be used, and we do use a variation of them later. However, the biggest problem of genetic algorithms is the sheer computational time it takes. It requires permutating over millions of possible combinations of predictors to end up with a reasonable model. In contrast, machine learning methods such as gradient boost more "quickly" find optimal decision trees at less of a performance cost. Furthermore, gradient boosted trees perform overwhelmingly well on sparse tabular data which was the data we were handling here. (Grinsztajn et al., 2022)
I had done a quick "proto-presentation" to the stakeholders involved showing my findings. As a result, we were able to quickly pivot away from regression models, which struggle on sparse and collinear data, and genetic algorithms, which have a high computation cost, and are less optimal compared to boosting techniques. This experience really showed me the value of documenting my results, and quantifying them in a way that is easily understandable to stakeholders.
Basic correlation
However, just because we have a boosting model, does not imply that we can just blindly throw data at it. In fact, throwing too much data may harm model performance. Thus, feature selection and creation is imperative to create competent models.
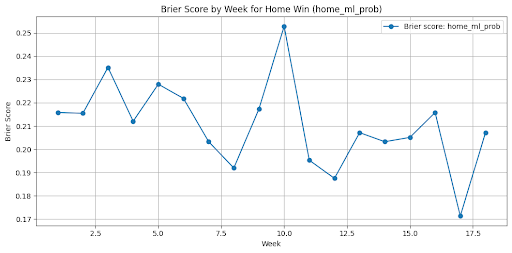
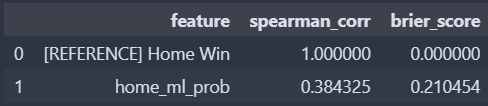
Betting markets
The biggest flaw with betting markets is that they're too good of a signal. Many times, betting markets may dominate and become the only signal used by the model.
ELO?
ELO is a zero-sum scoring system. When two teams compete, we give the winner n points and subtract n points from the loser. As a result, we can build a sufficient scoring system. An initial analysis shows us:
ELO MoV?
We can further improve upon ELO by potentially adding margin of victory. The more a team wins by, the more we reward them. This surely improves it, right? Right?
Not really, it causes a fair bit of overfitting too for some odd reason. I believe this has to do more with parameter tuning, rather than margin of victory being that decisive. Regardless, we do find overall margin of victory may be a false flag indicator.
Glicko: Failure
Glicko-2 was an improvement upon ELO. The idea was to also quantify time since last match (this could capture roster changes between seasons!), volatility, and uncertainty.
But glicko-2 actually does worse! Why? Glicko-2 is optimized for individual players, not teams. On a team level, Glicko-2 struggles because volatility and uncertainty wildly swing with team composition changes that can't be captured by single scalars.
In hindsight, I should have better researched Glicko-2 before blindly applying it, recognizing the limitations of the additional scalars it adds. As a final step to the model, I decided to recklessly apply hyperparameter optimization to the boosting model we're using. In truth, we should have relied on fine tuning given our data set of ~4000 games is easy to overfit.
Chapter 3: Implementation
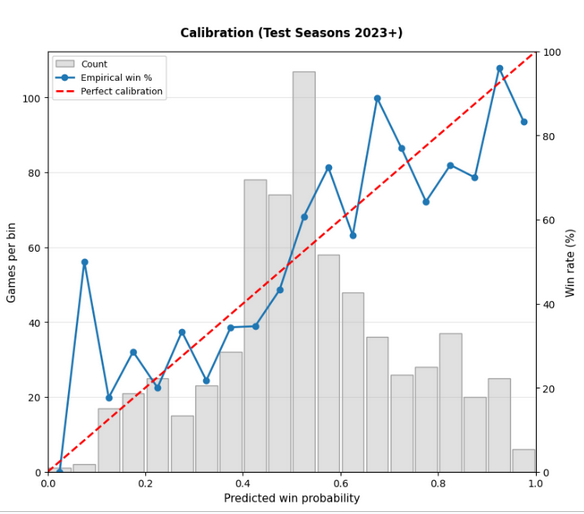
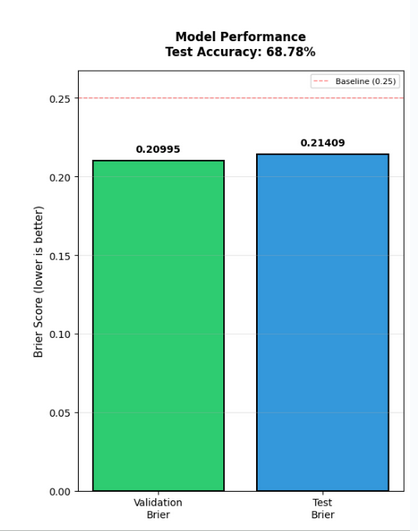
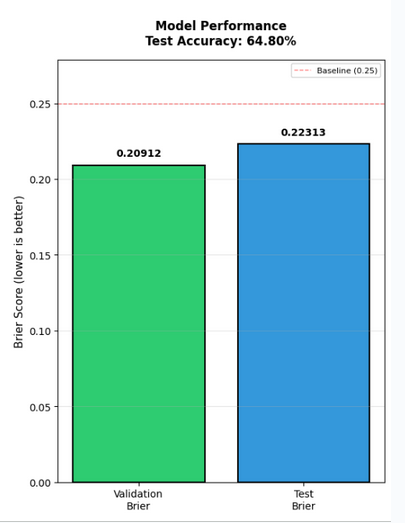
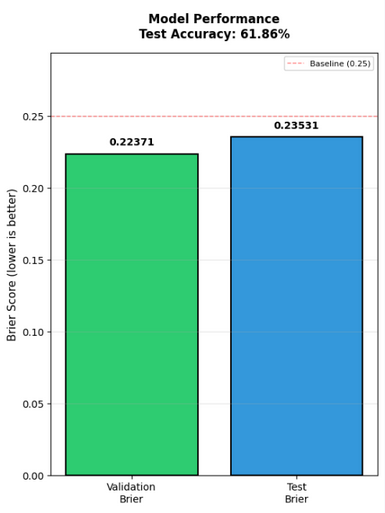
After finalizing the model, which gave us a Brier score of 0.217, we needed to actually put the model into our backend. The idea was to create an EventBridge which would run yearly training runs on the previous season's data with another EventBridge job linked to a Python lambda which will do data processing.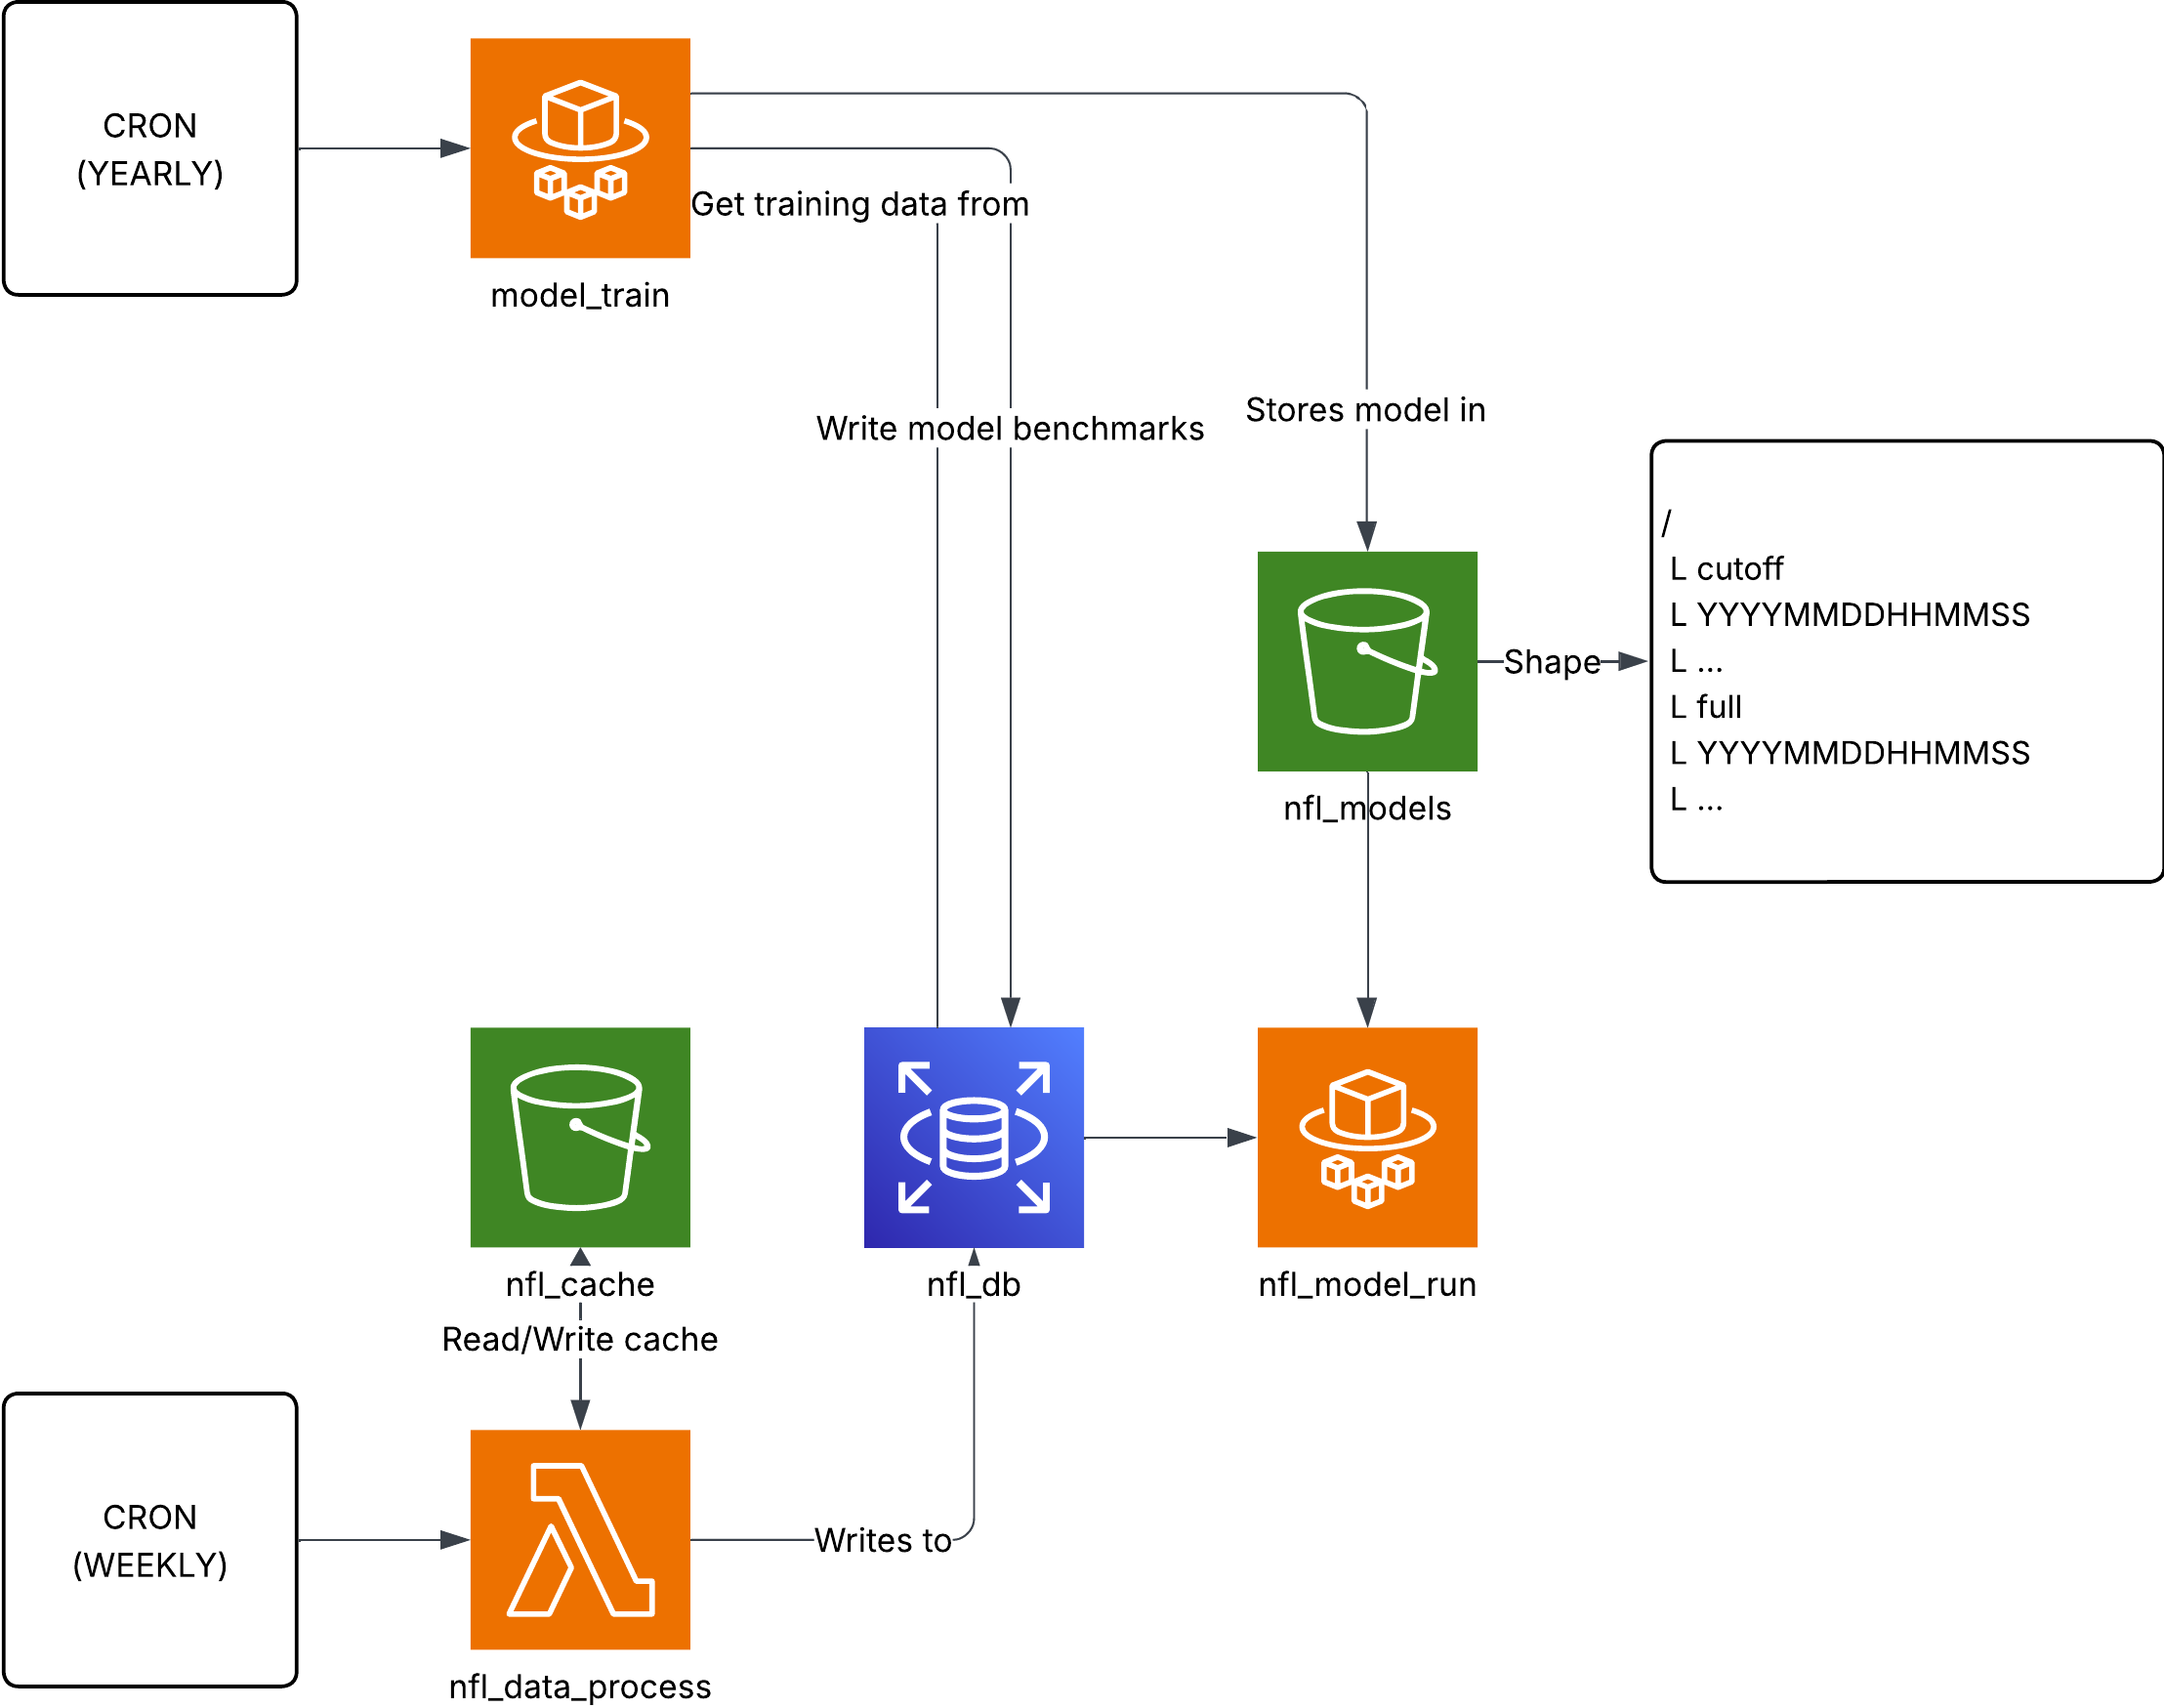
The data processing lambda would ensure we would cache weekly NFL game results so that both running and training the model could grab pre-computed data rather than recalculate it, saving AWS credits.
The entire implementation was done in Python. Surprisingly, this initial architecture plan is more or less the architecture still used. The most notable change was to the schema where we had to create a log in the database of each prediction and the model responsible for it for observability.
Chapter 4: Reflection
A Brier score of 0.217 isn't horrible; in fact, we're around 67% correct on our test data set. The problem is that we're using betting markets too which perform at a Brier score of 0.210 and an accuracy of 66%. If I could rewind time, I would look harder into regression analysis. Regression isn't the worst so long as our data doesn't have gaps or is highly colinear. In fact, many other models actually perform better (nflelo performed around ~0.2095 which is slightly better than betting markets), by relying more on regression analysis.
Furthermore, the fact that our model did worse even with features that would in theory improve the Brier score strongly indicates to me that the boosting model we're using is overfitting to some degree, weighing certain features higher than they should be. If I had more time, I would've spent it better fine tuning the parameters, however, with only 4000 games, even human tuning risks overfitting.
On the personal side, good did come out of it. Learning how to use Python beyond just small simple projects was really fun, and especially so with Pandas to process large sets of data. It was great coordinating and leading a small team to develop the win predictor, and resolving misunderstandings. Furthermore, the presentations I had done went extremely well! We were able to convey a lot of core documentation, but also project plans, and reasoning in both presentations.
Chapter 5: End
My time at ComPeters, primarily doing data analysis, was made amazing thanks to the new learning I had to do such as learning Pandas and AWS. I learnt a lot, especially beginner machine learning concepts, and this experience strongly prepared me for future courses like Cloud Computing. I was also able to build strong communication skills, both with stakeholders and project peers. I would like to thank my co-op supervisor, Shane Hart, for all the guidance and patience he provided.